Built for the Clair Z1
Spatial rheology
Particle size and viscosity, measured where you point. Spatial rheology combines quantitative phase imaging with dynamic light scattering, so one field on the Z1 covers single proteins at 3 nm up to whole samples at 3 mm.
Free to try on macOS and Windows. No Z1 needed: the demo dataset downloads from inside the app.
Viscosity or particle size for every object
Draw a box, and Jitterline finds every object in the phase image. For each one, it measures how the particles inside it move and gives you its viscosity or particle size, along with its size, shape and concentration.
Jitterline
Z1 connected
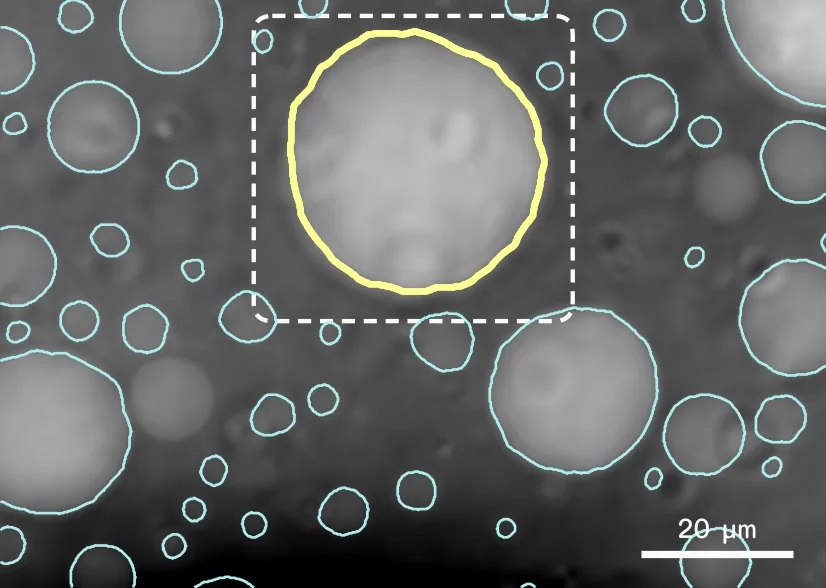
Diameter
30 µm
Diffusion
0.50 µm²/s
Viscosity
8.5 mPa·s
Concentration
99 mg/mL
How it works
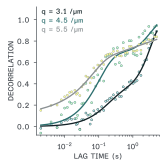
Small particles jitter. The faster they diffuse, the faster the image flickers. Jitterline measures that flicker at every length scale, in any region you choose, and turns it into a diffusion coefficient, then a size or a viscosity.
Image
A quantitative phase image finds every droplet, cell or particle in the field.
Record
A few seconds of high-speed video of the same field, up to ~560 frames per second.
Analyse
For each region, how fast the image decorrelates at each length scale gives the diffusion coefficient [1].
Report
Stokes–Einstein turns it into particle size, or into viscosity with a probe of known size.
Measures
Diffusion coefficient · Hydrodynamic radius · Viscosity · Droplet size and shape · Concentration from refractive index
Two examples
From the protein to the condensate. Both from 5 µL samples and single recordings on a standard Z1 with its 40× objective.
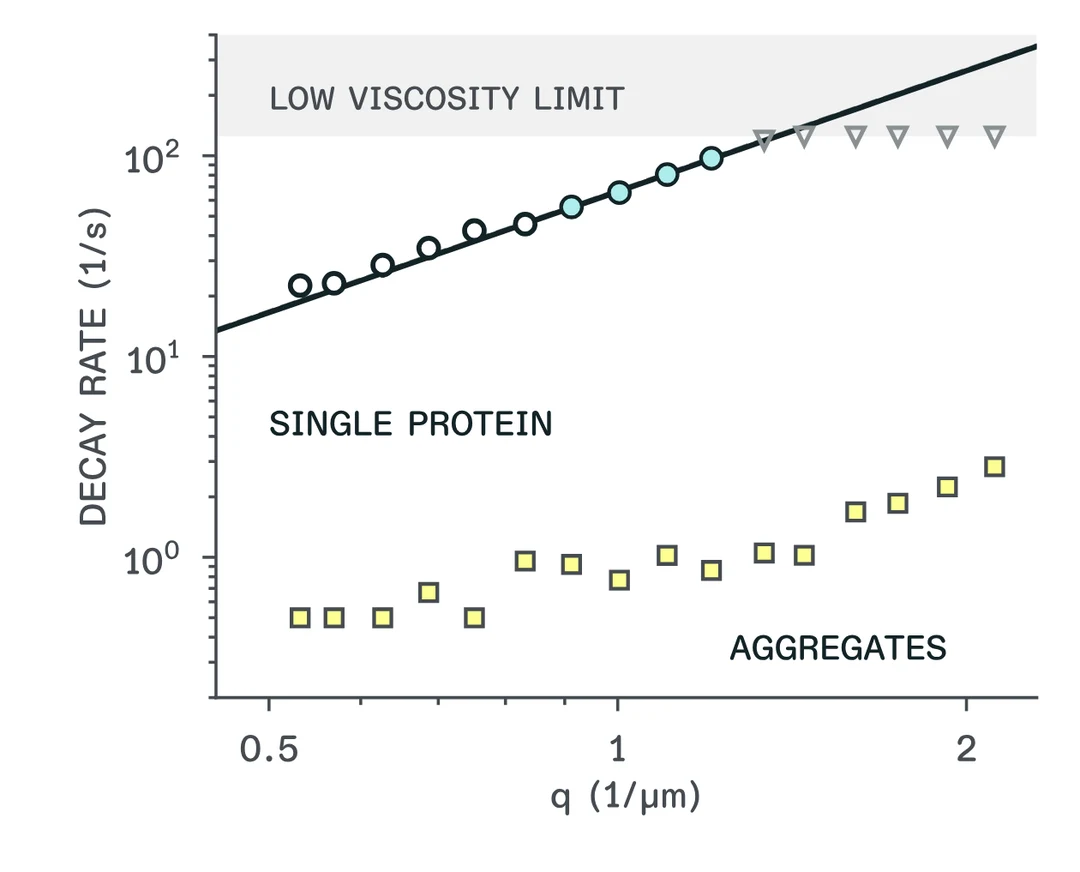
Single protein · BSA in saline
3.55 nm
Hydrodynamic radius of bovine serum albumin from one 18-second recording, with aggregates about 100× larger (~370 nm) separated in the same data. Published DLS gives 3.4 ± 0.1 nm [2].
Condensate · PEG/dextran
8.5 mPa·s
Viscosity inside a single 30 µm droplet, and the same for all 83 droplets in the field, alongside each droplet's size and concentration from its refractive index. Below: viscosity across the droplets.
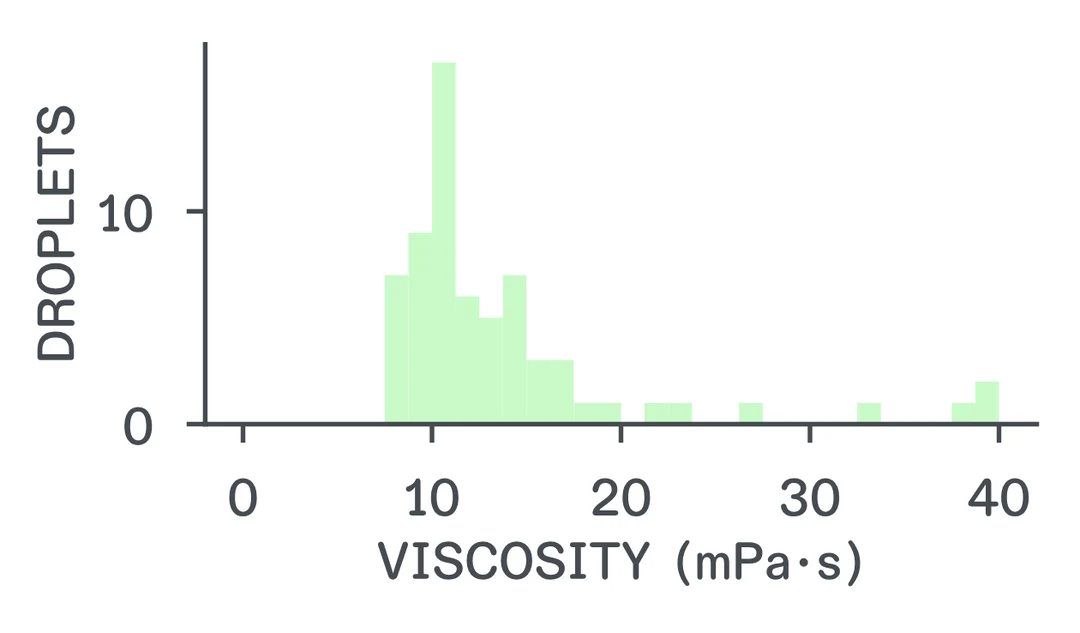
Viscosity calibrated with a certified 100 nm polystyrene standard in glycerol–water; repeatable to 2–3%. Read the application note for the full data.
What it changes
Dynamic light scattering averages over a whole cuvette. Rheometers need millilitres. Spatial rheology measures inside the structures you can see.
Local
Size and viscosity inside one droplet, across many, or in the liquid between them.
Multi-scale
Light scattering below the resolution limit, phase imaging above it. 3 nm to 3 mm from one field.
Correlative
Every viscosity comes with the object's size, shape and concentration, so you can explore the whole population.
Label-free
Proteins and aggregates measured in brightfield. Nothing to stain or bleach.
Small samples
From 1 µL, on coverslips, slides or 6–384-well plates.
Fast
About three minutes per field, and repeatable as a time series to follow aggregation or ageing.
Specifications
- [1] Cerbino & Trappe, Phys. Rev. Lett. 100, 188102 (2008). doi:10.1103/PhysRevLett.100.188102
- [2] Guidolin et al., Macromolecules 56, 8290 (2023). doi:10.1021/acs.macromol.3c00782
What it costs
Trying it is free: download the app and run the demo dataset. To run experiments on your own Z1, you need the upgrade.
Spatial rheology upgrade
per Clair Z1
€9,000
Excl. VAT
- Unlocks spatial rheology on one Z1, for good
- Software updates included
- Remote onboarding and training included
- macOS and Windows
- Free trial with the demo dataset, no Z1 needed.
- Runs on your own computer; your data stays with you.
- Don't have a Z1 yet? Talk to us.
Free to try
Try it today
Download Jitterline and test spatial rheology on our demo dataset, even if you don't (yet) have a Z1.
macOS 12+ · Windows 10+