Analysis Software for the Clair Z1
Blobline
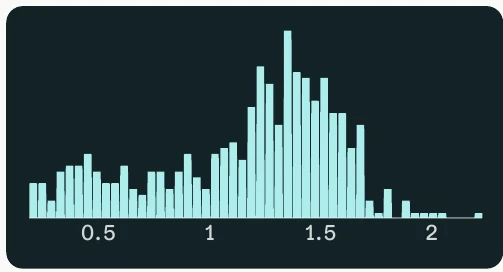
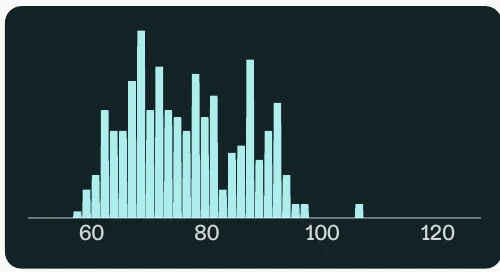
Condensates, measured. Blobline takes a Z1 measurement, finds every condensate in the field, and gives you its size, wetting angle, refractive index and the concentration of each component. Every object is measured on its own, so you get distributions, not averages. It costs €9,000.
macOS (Apple silicon) and Windows 10/11. No Z1 needed to try it: the demo measurement downloads from inside the app.
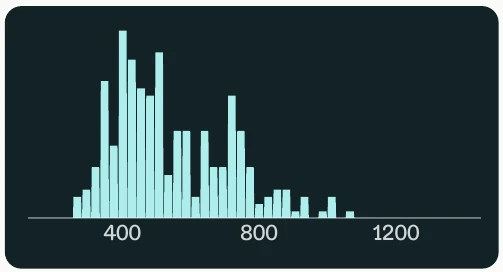
What you can use it for
Fluorescence tells you where a protein goes. Blobline tells you how much of it is there, without a label.
Phase diagrams
Dense-phase concentrations across conditions
Measure the dense phase at each composition and build up the phase diagram from real concentrations, not turbidity.
Screening
Buffers, salts, pH and constructs
Compare how a mutation or a change of buffer shifts droplet concentration, size and wetting, well by well across a plate.
Kinetics
Time series
Timed repeats follow the droplets as they form, grow, age and harden.
Aggregates
Counting and weighing aggregates
Phase delay scales with dry mass, so dense aggregates are counted, sized and weighed in picograms.
What you measure
A shape-agnostic forward model gives a full physical and chemical description of every segmented object.
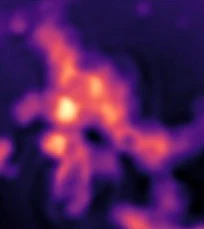
Measured 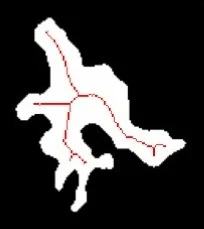
Morphology 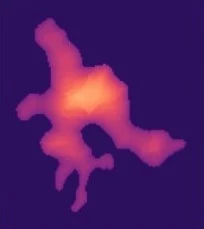
Calculated Beyond spherical droplets. A branched protein + RNA condensate. No spherical shape is assumed, so concentration and surface tension come out whatever the shape. That matters for gelled condensates, which tend to irregular shapes.
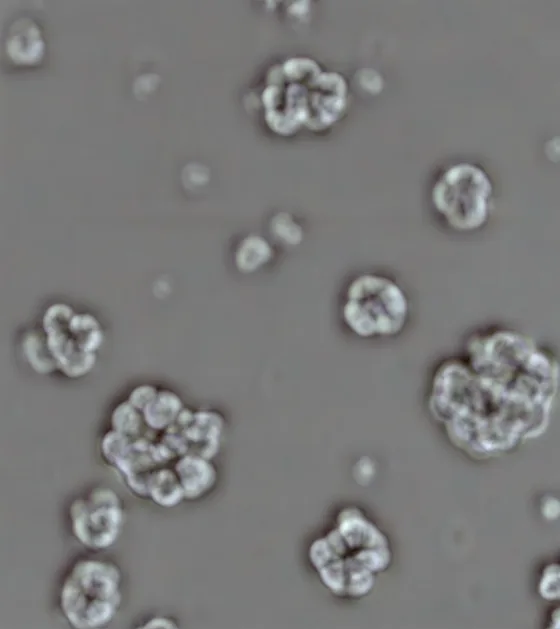
Quantitative phase 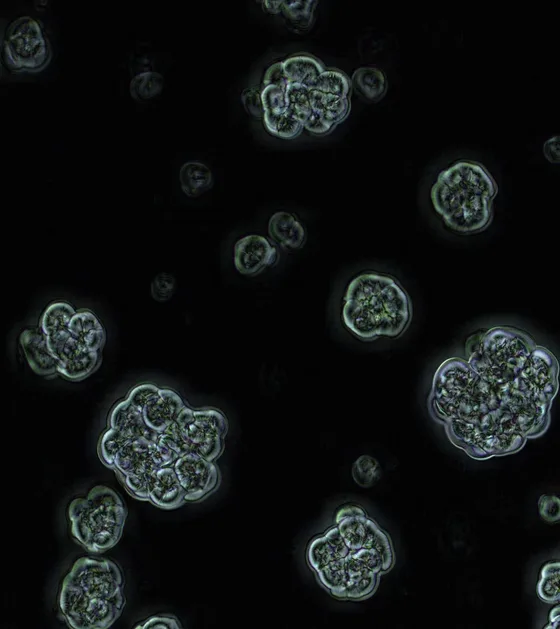
Scattering 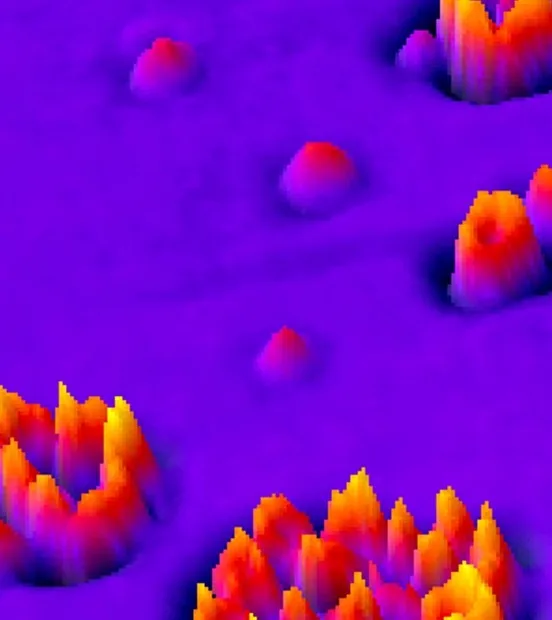
Phase in 3D Dense aggregates. Insulin aggregates in a 96-well plate, segmented, counted and measured for size and insulin mass. Phase delay scales with dry mass, so the 3D surface maps mass directly.
Why Blobline
Label-free
No dyes or tags to perturb the protein or bleach. The Z1's phase image is the measurement.
Distributions, not averages
Every object is analysed on its own, so you see the spread across the population instead of one number.
Any number of solutes
Concentrations for as many protein or peptide species as you have, given by sequence or physical properties.
End to end, in minutes
Acquisition, segmentation and analysis in one instrument and one interface, across wells, fields and time points.
Says when it can't tell
If the data can't settle a question, Blobline says so instead of guessing.
Keeps itself current
Runs on your own computer, and offers each new version when it starts.
Blobline builds on published label-free methods, including ATRI, which turns a condensate's refractive index into its composition [1]. For an overview of experimental methods for condensate thermodynamics, see [2].
How it works
Blobline uses a Bayesian statistics approach to determine the refractive index of the droplets, from which it then determines their concentration. Determining the concentration uses the ATRI method [1], and requires knowing the average and dilute-phase concentrations a priori.
Measure
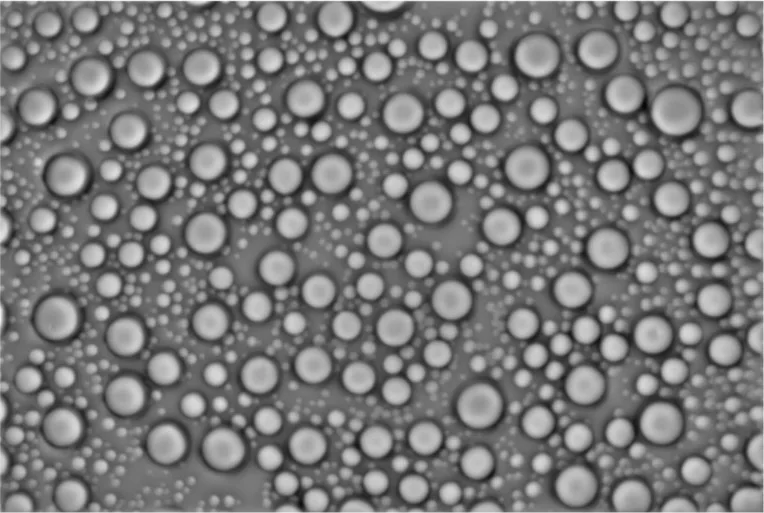
A focus stack from the Z1.
Segment
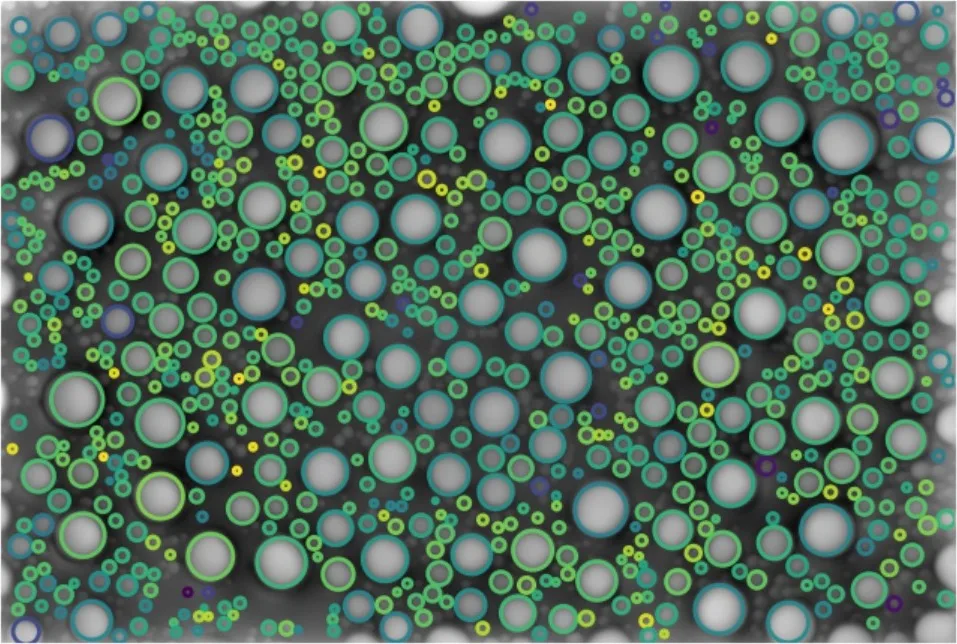
Every droplet outlined.
Refractive index
Bayesian fit of each droplet's phase profile.
Concentration
Δn to mg/mL with ATRI.
Export
Plots and tables.
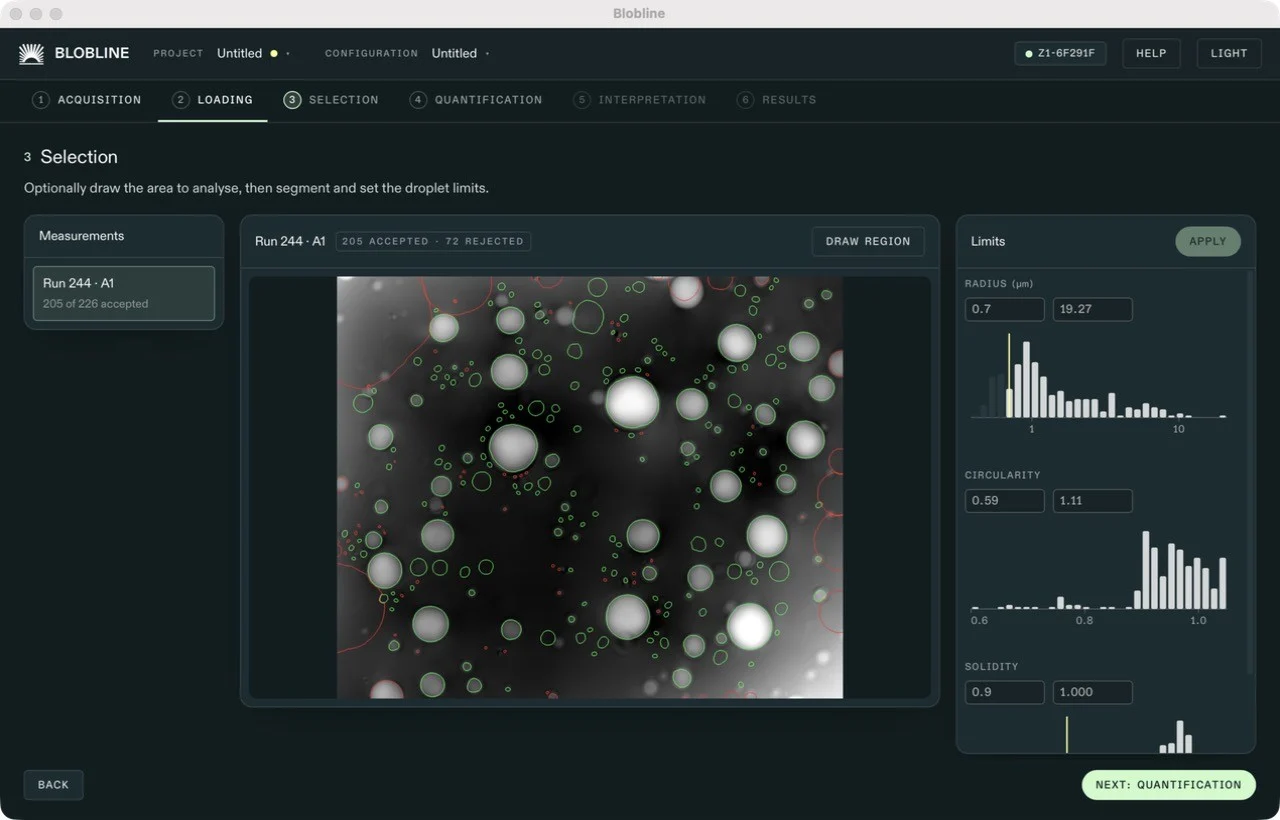
Labware: 6–384-well plates, ibidi slides, coverslips and custom microfluidics. Read the biocondensate application note.
- [1] P. M. McCall et al., A label-free method for measuring the composition of multicomponent biomolecular condensates, Nat. Chem. 17, 1891 (2025). doi:10.1038/s41557-025-01928-3
- [2] S. Ray & A. K. Buell, Emerging experimental methods to study the thermodynamics of biomolecular condensate formation, J. Chem. Phys. 160, 091001 (2024). doi:10.1063/5.0190160
Analysis software
Try it today
Download Blobline and run it on our demo measurement, even if you don't (yet) have a Z1.
macOS 11+ on Apple silicon · Windows 10/11, 64-bit