Cell Biology
Label-free imaging and analysis of living cells — fast, automated and straightforward. Count, viability, dry mass and morphology from a single measurement, with no dyes.
Four contrasts from one measurement
Brightfield, phase contrast, DIC and scattering all come from one acquisition of the same field, perfectly registered — nothing added to the culture, and nothing to bleach or photodamage.
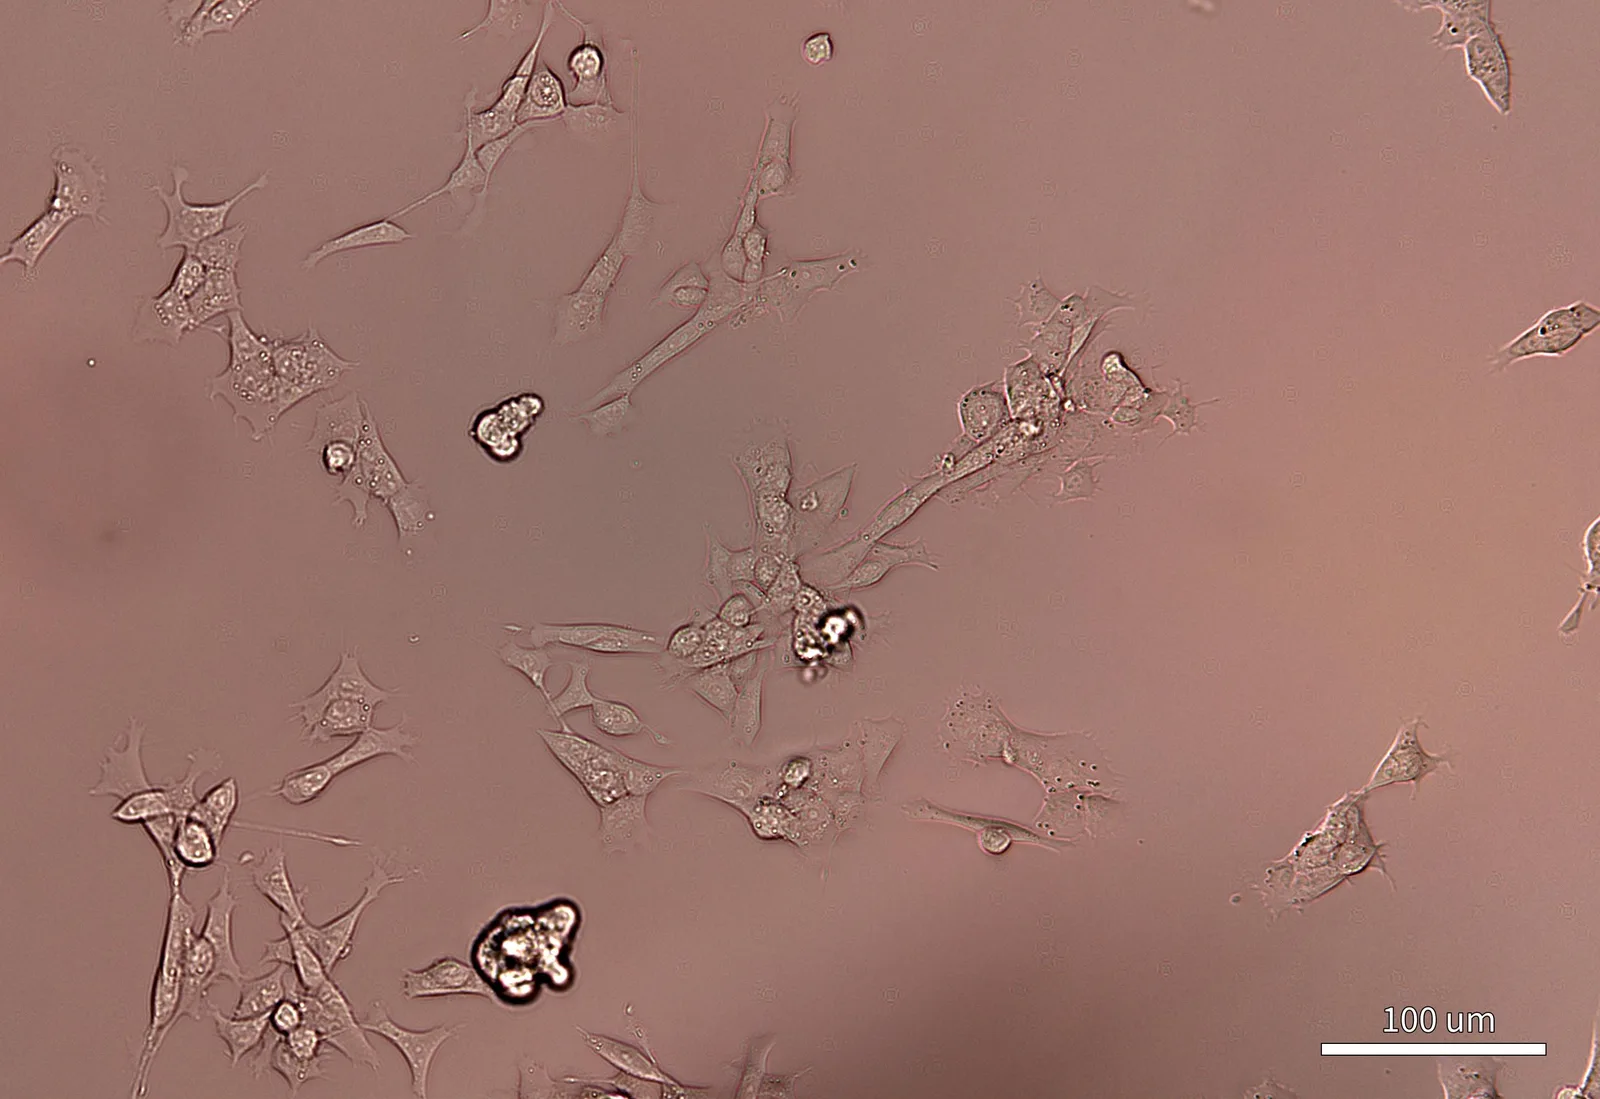
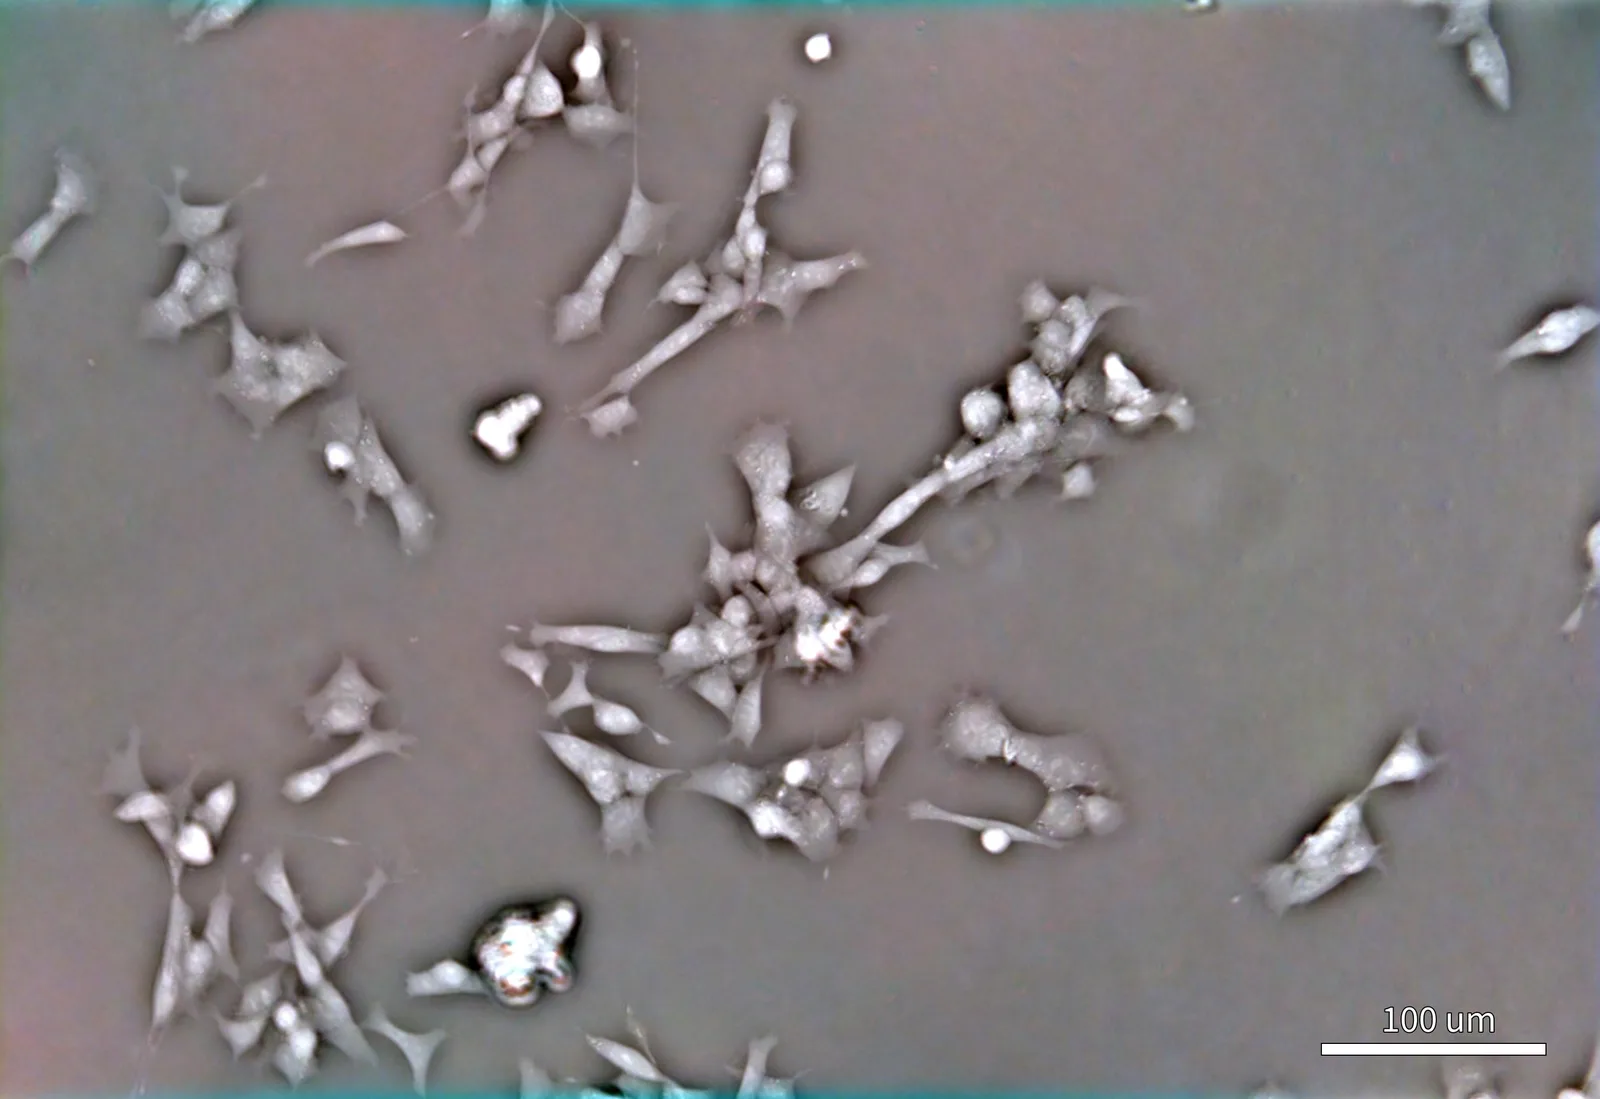
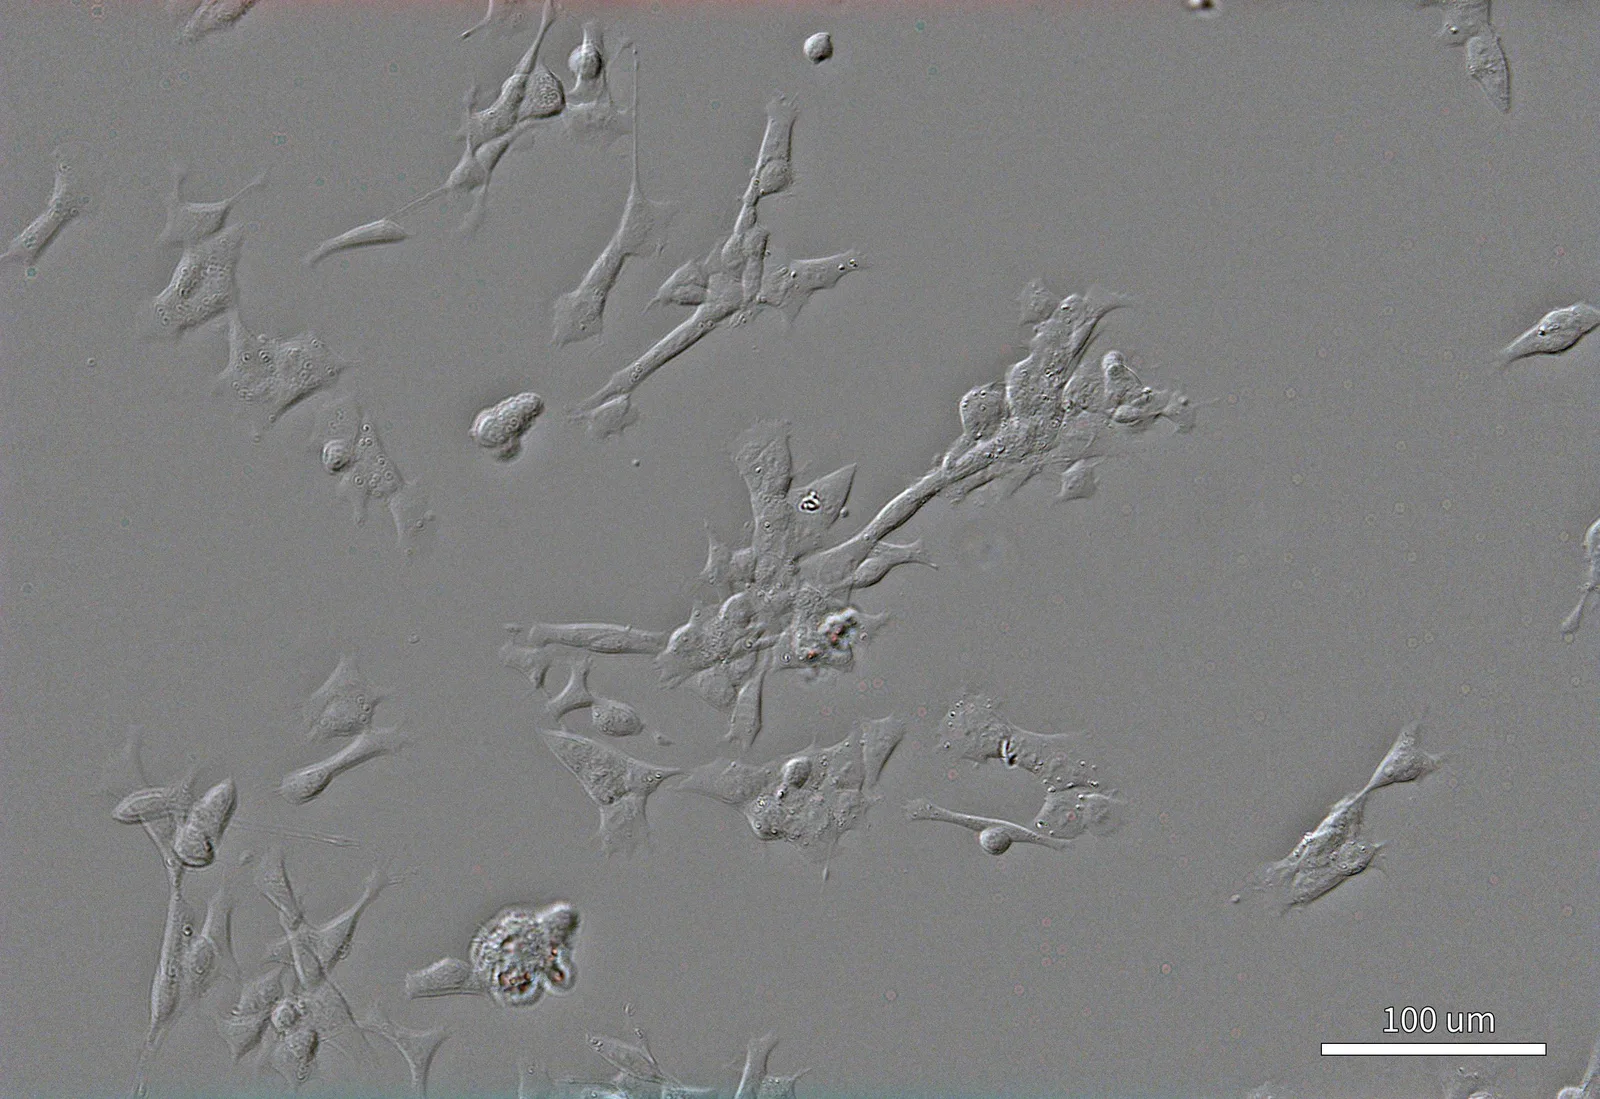
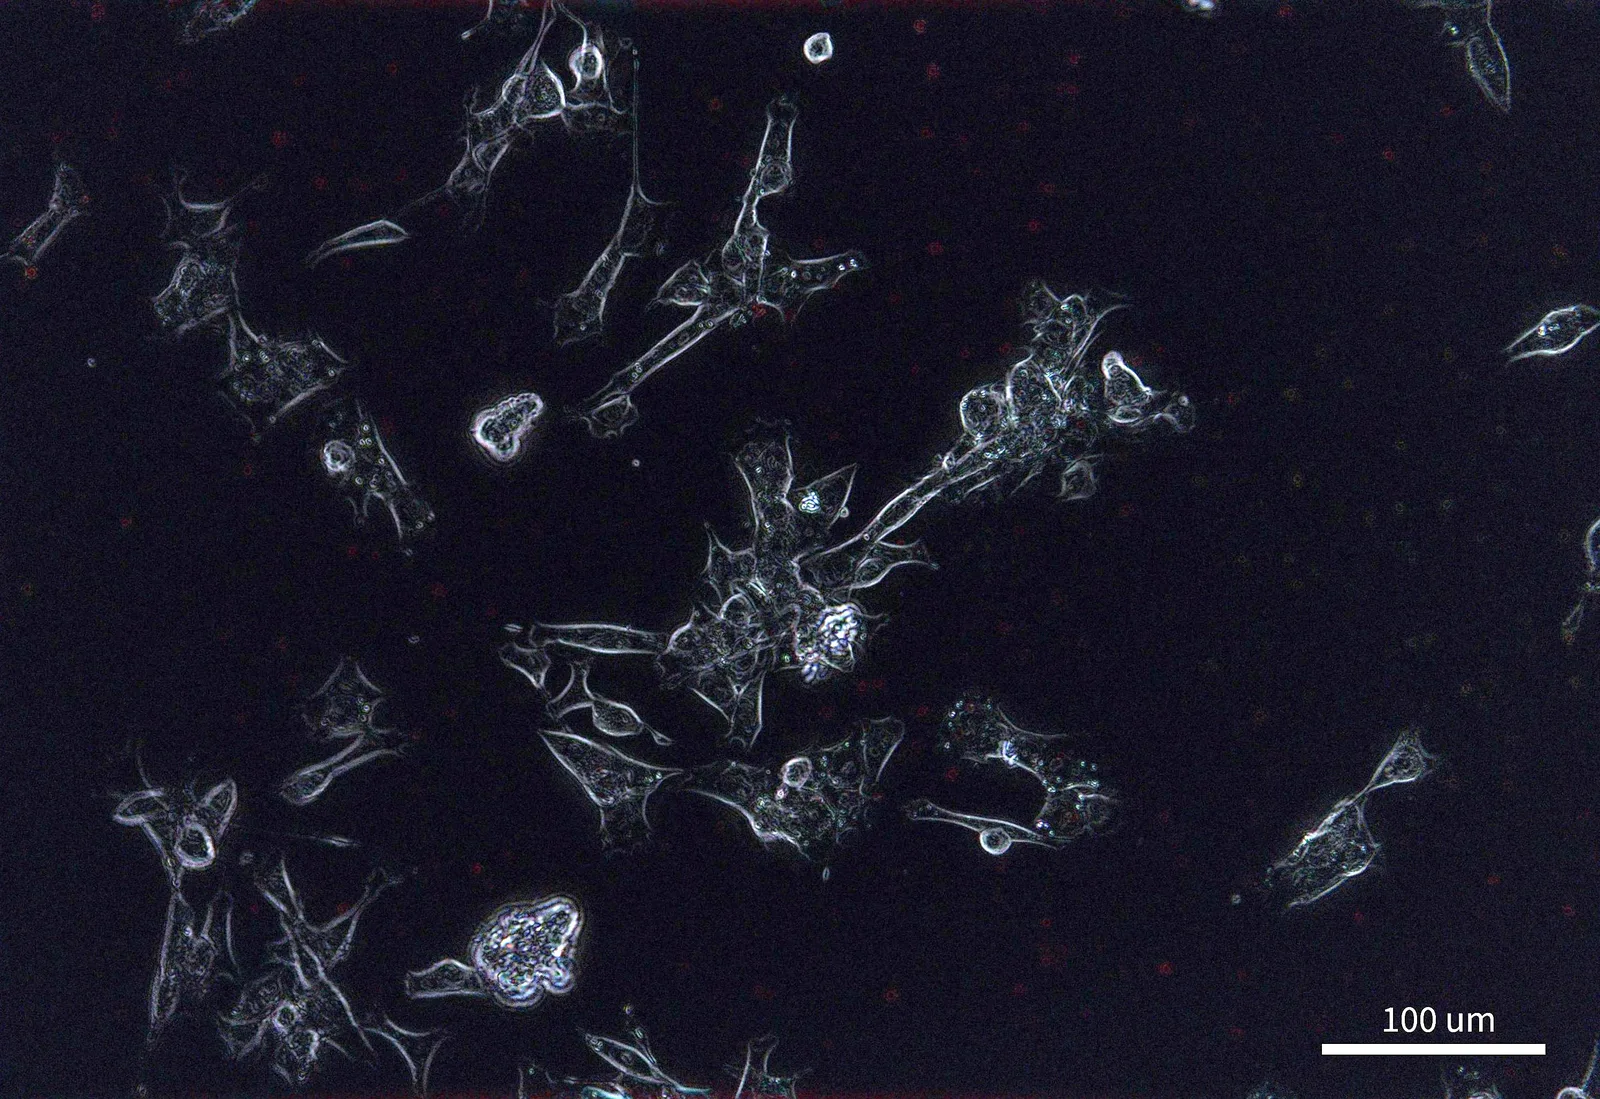
The same field in all four contrasts. Scale bar 100 µm.
- 01
Dry mass, every image
Dry mass, density, area and morphology, cell by cell.
- 02
Nothing added, nothing damaged
No dyes, fixation or transfection, and too little light to stress the culture.
- 03
Lives in the incubator
Fits a standard CO₂ incubator, so cells never leave their conditions.
6–384-well plates, petri dishes, Ibidi chambers · Time-lapse inside the incubator · Remote monitoring and control · Python API for fully customised routines
Every cell counted, weighed and classified
Machine-learning segmentation finds every cell in the field and scores it live or dead without stains. The same phase image gives each cell its dry mass, density, area and morphology.
Count and viability
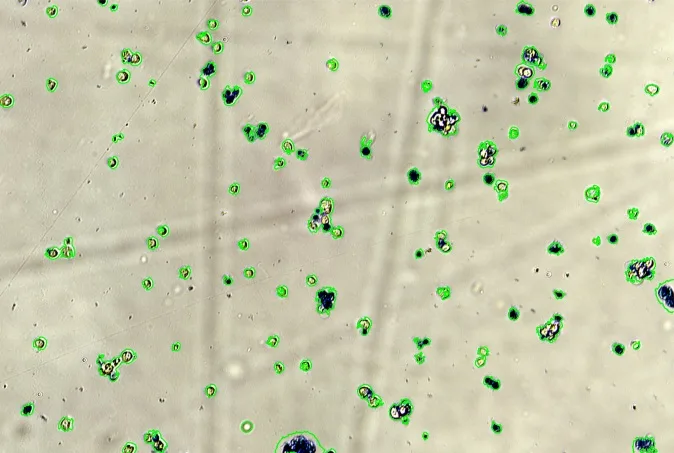
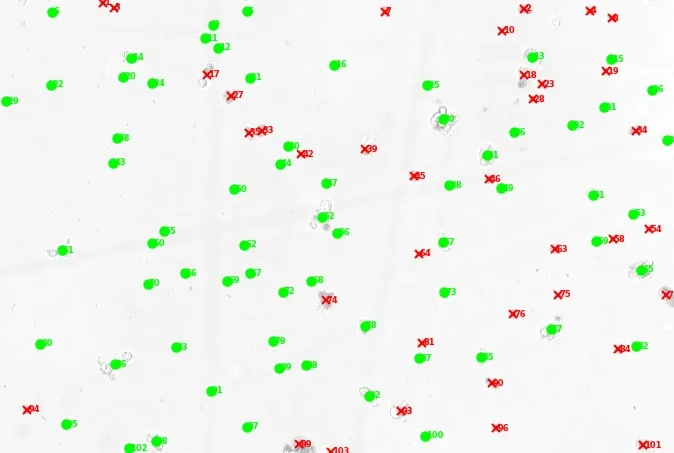
Viability analysis of 103 Drosophila melanogaster Schneider 2 cells in one field: 66 scored live (green), 37 dead (red).
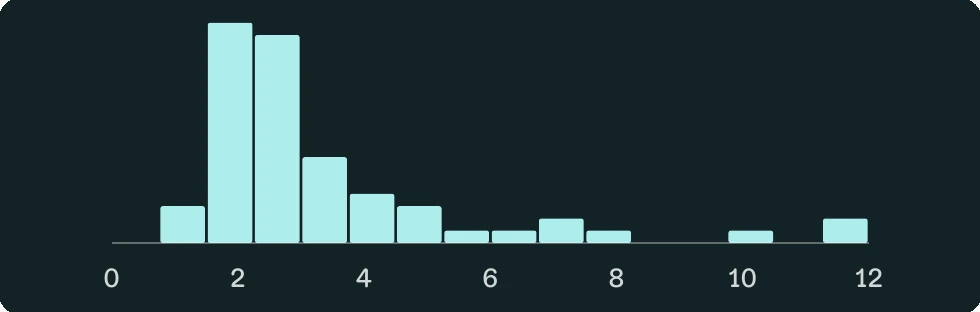
Dry-mass density
Assays: Counting · Confluence · Viability · Morphology