Liquid-liquid phase separation
- Simple, fast, and reliable multi-wavelength imaging of liquid-liquid phase separation, including coacervates and biomolecular condensates.
- Quantitative measurement of droplet concentration, size, and wetting angle; either individually or as statistically significant ensembles.
- Complete automation and remote instrument control and monitoring
Introduction
Liquid-Liquid Phase Separation (LLPS) in biomolecules refers to the spontaneous segregation of molecules into a dense, concentrated phase, and a more dilute one.
Crucially, LLPS plays a key role in forming membraneless organelles and is believed to contribute to various neurodegenerative diseases through the misregulation of proteins like TDP-43, FUS, and α-synuclein.
Today, LLPS is most commonly characterized via fluorescence microscopy, turbidity, and UV absorption, but there’s a growing need for more quantitative methods of understanding the myriad of functions and behaviors of LLPS under different concentrations. Excitingly, the possibility of automating these measurements with high-throughput opens the door to systematic, combinatorial studies.
The Challenge of Characterizing LLPS
The unusually broad range of spatio-temporal phenomena that underpin biocondensation processes means there are few affordable experimental methods that can characterize them in a single setting. Even fluorescence—arguably the gold standard—has three key drawbacks:
- Phototoxicity due to the (usually) high illumination flux required.
- Perturbation from labelling that can affect chemical and/or biological function.
- Experimental bias due to the selected fluorescence target and the subsequent exclusion of other potentially relevant targets.
A New Approach with the ClairSci Z1
Here we demonstrate the Z1 instrument for characterizing LLPS in the n1 domain of human DEAD-box helicase-4 (DDX4N1): an RNA helicase protein involved in the formation of egg and sperm cells whose intrinsically disordered region facilitates phase separation—an ideal model system.
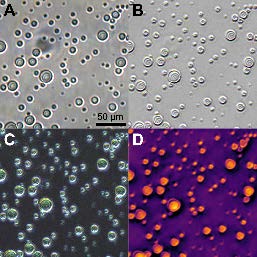
Figure 1: Full-field images of DDX4N1 microdroplets across all default contrast modes available to the Z1 microscope:
- A) Brightfield
- B) Differential Interference Contrast (DIC)
- C) Scattering Angle Magnitude (GAMP)
- D) Quantitative Phase Contrast
Images are acquired at 20X magnification (0.28 µm pixel size) and cropped square for presentation.
Samples courtesy of R. Nørrild & A. Büll, Technical University of Denmark.
Sample & Measurement Details
- Sample composition: 100 µM DDX4N1 CtoA, 100 mM NaCl, 20 mM sodium phosphase (pH 6.5).
- Preparation: Mixed and pipetted onto a No.1 glass coverslip, covered by a second coverslip separated by a 50 µm mylar boundary.
- Instrument setup: Clair Scientific Z1 microscope, 20X Nikon Plan Fluor objective lens (NA 0.5).
- Settings: 80% brightness, 30 ms exposure time after recalibration.
Results & Discussions
Figure 1 shows images of the sample in the four WARP-derived modes. All modes clearly show the round outlines of the condensates, which form 10–40 µm diameter droplets.
However, the phase contrast output from the WARP measurement enables droplets to be characterized quantitatively in terms of their refractive power. The parabolic phase profile measured from spherical-cap shaped droplets with homogeneous concentration can be numerically fit to determine:
- Refractive index
- Wetting geometry
By correlating this data with ex-situ measurements of the refractive index of phase diagram end members, droplet concentration can be determined directly for all droplets within the image field of view.
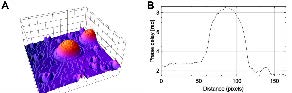
Figure 2: 3D surface map of the phase around a DDX4N1 droplet, showing the parabolic spherical-cap profile.
References
- S. Ray & A.K. Buell, J. Chem. Phys. 160, 091001 (2024)
- R.K. Nørrild et al., Angew. Chem. Int. Ed. 63, e202404018 (2024)
- P.M. McCall et al., Nat. Chem. (2025)